I had the privilege of attending class in Mr. Martinez’s 8th grade class again last Friday. If you haven’t read about Abraham’s class, I’d encourage you to here or here! He’s such a stellar teacher and I appreciate every opportunity I have to attend his class.
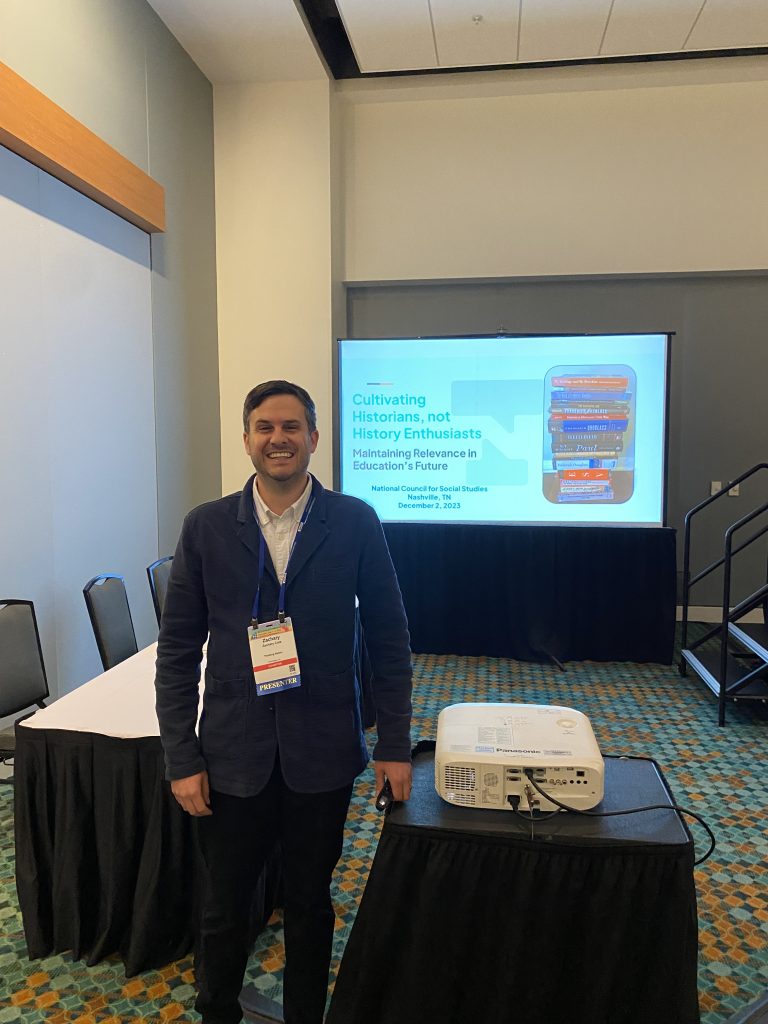
Abraham and I will be presenting together next Saturday at the California Council for Social Studies, where our session is titled “Cultivating Community through Socratic Seminars.” At Thinking Nation, we’ve been quietly building Socratic Seminars for all of our units and Abraham has been generous enough to pilot them and reflect on his experience during our CCSS session.
On Friday, I walked into his classroom in the middle of a seminar (sorry kids! Also, c’mon meetings…) and was instantly excited by what I walked into. The students had just finished engaging in one of our Curated Research Papers on Slave Resistance and were participating in the Socratic Seminar as the final piece before they wrote their essays. The inquiry question for that unit is “How did enslaved people resist their enslavement and why is this historically significant?” As I listened to the students, I heard them answering complex questions, referring to primary sources, and citing evidence from those sources to defend their answers. In fact, one of my favorite sounds during the 1.5 hours I was there was the 15 pages turning at once when a student spoke up and said something like, “As shown in Document B.” To hear the pages flipping in unity was a joy to historian ears.
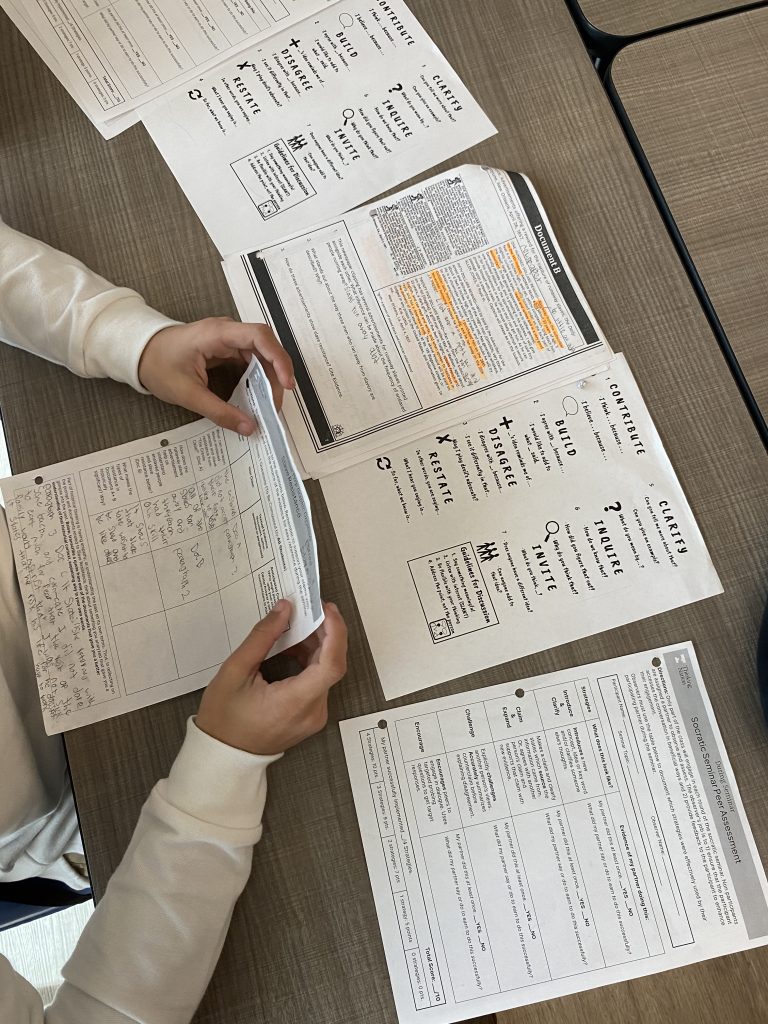
While I recorded many insightful moments provided by the young scholars in the room, I’ll share just a couple of them here.
The first example demonstrated a student’s commitment to methodology. Multiple students in the inner seminar circle were bringing up the point that running away was the greatest form of resistance. After hearing this multiple times, one student chimed in, “Wait, I’d like to ask a question. What are you guys referencing when you are saying that running away was the most common way to resist?”
This may not seem like much on the surface, but in this moment, the student wanted to source the claims she was hearing. She followed good historical thinking practice and asked a question of sourcing to the students. This high standard for evaluating claims is the type of disposition our democracy requires (Fortunately, the students were able to point her to the section of their materials that made that claim).
The second came when the students were discussing the significance of runaway slave advertisements. In a seemingly simple observation, a student said, “I’d like to add that running away was so common because they put it in the newspaper and it had its own section.” He went on to expand that it wasn’t just the language of the advertisement that revealed significance, but it was the existence of the ad. To him, the fact that newspapers would dedicate copy space to this regularly demonstrated just how prevalent of an event it was. This was great contextualization at work!

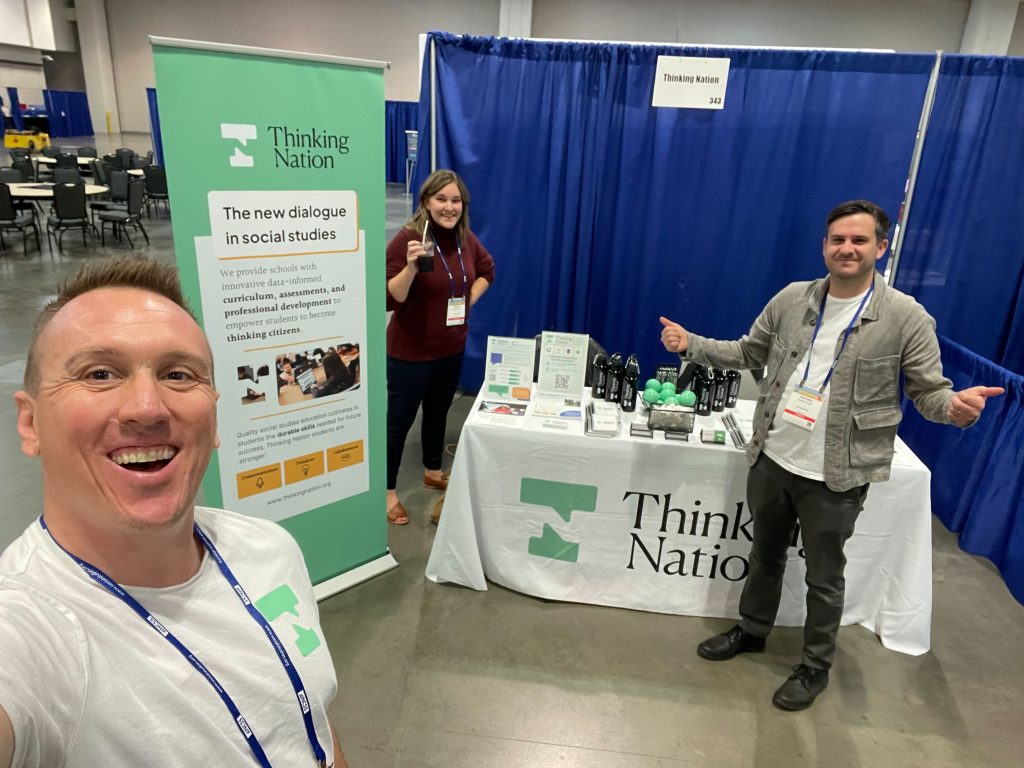
I was so impressed by what I heard in the class that day, and I hope that if you are planning to go to CCSS that you come to our session on socratic seminars or at least stop by the Thinking Nation booth (401) and say hi!
Thinking Historically About Podcast
Today we released episode 5 of our mini podcast series “Thinking Historically About the State of Social Studies Education.” As the other episodes have been for me, this was another great conversation with a insightful leader in the education space. My guest was Dr. Janet Tran, the Director of The Center for Civics, Education, and Opportunity for the Ronald Reagan Presidential Foundation and Institute. If you read the blog a couple weeks ago, Janet was the mind behind the incredibly thought-provoking roundtable at the Reagan Library. Her deep and layered thinking only further shined in my conversation with her on the podcast. Please listen!
It’s been a busy week but also incredibly fulfilling. If you plan to attend the National Council for History Education’s conference in Cleveland please come say hi on Friday. And for my fellow Californians, I’ll see you Saturday in Garden Grove for CCSS!


