If you’ve been in the same room as me more than once, you’ve probably heard me say something like “We evaluate what we value” (A phrase I ironically got from a math pedagogy book).
I have become more and more convinced of the importance of evaluation and assessment to the strengthening of social studies education. In fact, not long ago, I fleshed out some of my thinking on this topic in an article over at The Fulcrum: For the Sake of Democracy, We Need to Rethink How We Assess History in Schools.
In the piece, I write:
“For the sake of our democracy, we need to rethink how we assess history. At Thinking Nation, the nonprofit I lead, we’ve created assessments that serve three purposes:
- Accurately representing the discipline of history
- Accurately reflecting the values of what we hope citizens can contribute
- Facilitating a common language of success for stronger vertical alignment in schools
Rather than making the content taught the end goal of any given lesson or unit, we’ve made it a means to an end. Our lessons and assessments are content-rich, but use that content to support the assessment of student thinking and writing practices… Students who engage with these assessments walk away from their history classrooms with a fuller understanding of the discipline of history… They are stronger readers and writers, but they are also more impactful citizens. We are evaluating what we value.”
Assessments matter because they serve as the data that informs our instruction. Even more, they serve as the data that informs our field and the state of education. This is why we emphasize our formative assessments on historical thinking and our summative assessments, which we call Curated Research Papers. These assessments provide data on dispositions that we value. The better that data is, the more informed our decisions are, and, the stronger our students are.
The new minimum standard in history education must be data-informed. This is why we are continuously making the data aspects of our online platform even stronger for our school partners. Our Data Analyst, Valentina Carvajal-Bueno, and our School Success Manager, Johanna Jackson have put together an overview of the latest data-informed features below.
If you are a school partner with us, tell us how this new platform feature is supporting you in your teaching! If you aren’t a school partner yet, contact us! We’d love to work with you.
Thinking Nation – New Feature Highlights
In this week’s post, we want to highlight one of our most recent development efforts to strengthen how teachers access data and insights in our platform. Earlier this year, we launched new tools in the Reporting tab designed to give teachers clearer visibility into student performance and progress, all in one place.
Two ways to report
Inside the Reporting tab, teachers will now find two reporting options:
- Singular Reporting - Run reports based on a selected resource to understand performance and progress at a glance.
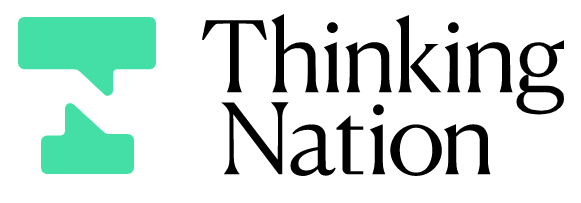
- Comparative Reporting - Compare two different CRPs side by side and view results across all rubric categories, making it easier to spot trends, growth, and areas where students may need support.

Once a report is generated, teachers can instantly see visual breakdowns of key rubric categories, including Thesis, Purpose, Contextualization, Textual Evidence, etc. These charts help teachers identify patterns quickly, for example, where students are consistently strong and where they may need targeted support, without having to open individual submissions one by one.
Feature highlight: Assigned vs Submitted
Another useful addition is the ability to quickly see how many Curated Research Papers (CRPs) have been assigned versus those submitted. This gives teachers an immediate snapshot of student completion and engagement, and helps guide follow-up conversations with students.

Built for action and easy sharing
To make reporting more usable in real classrooms and team settings, teachers can filter by students and download the report as a PDF. This makes it easy to save a snapshot for records and sharing.
For a visual guide of the new reporting features, please watch the video below:
We're working every day on features like this, and we have a lot more on the roadmap for this year. Stay tuned!

Post a comment